The Power of Chrome Tab Groups: An Ultimate Guide to Boost Productivity
Indeed, Google Chrome has been one of the favorite browsers of ...

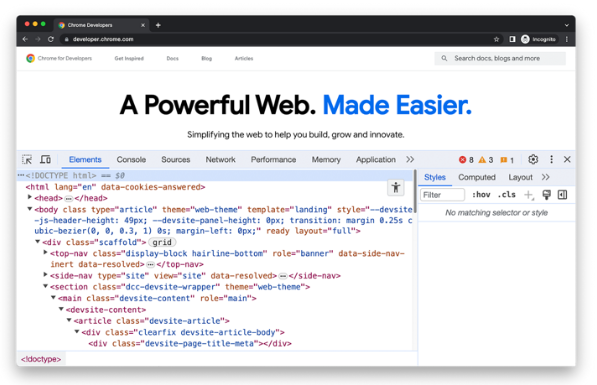
Google Chrome has carved out a niche for itself as the number one in the world of web browsers among casual users and pros alike. Some of the power-packed yet underutilized features in Google Chrome include a set of Developer Tools, or simply DevTools. While most developers were first introduced to either the basics of debugging or the inspection of elements, advanced developer tools in Google Chrome go deeper into allowing the developer to optimize performance and improve accessibility and go deep into insights on web applications.
In this article, Advanced Chrome DevTools will be introduced, touching on little-known features and seldom-used functionalities. From a professional developer to a hobbyist, this tutorial will shed light on new ways to debug, analyze, and refine your web projects using the advanced Developer Tools in Google Chrome.
Google Chrome Developer Tools are a set of web authoring and debugging tools built right inside the browser. DevTools allows developers to see the structure of a web page, diagnose problems, and analyzes performance in real time.
While most developers only use its basic features, such as inspecting elements or viewing the console, Chrome actually has some advanced tools that could revolutionize your development workflow. From in-depth performance monitoring to custom debugging workflows, Advanced Developer Tools in Google Chrome solve problems that would require standalone software or complex scripts.

Advanced features of Chrome DevTools include deep dives-style of debugging, and not just superficial debugging. The developer is enabled to:
Now let’s get into some advanced capabilities of Advanced Developer Tools in Google Chrome and how they’ll make you a better web developer.
The Performance Panel available in Chrome is a powerhouse of information that allows developers to study website performance in real-time.
How to Access:
Press Ctrl + Shift + I (Windows/Linux) or Cmd + Option + I (Mac), go to the “Performance” tab.
Key Features:
Use Case:
A slow-loading website irritates users. With the Performance Panel, developers can pinpoint slow scripts, large assets, or rendering issues, then optimize them for a smoother user experience.
Lighthouse comes out of the box with Chrome DevTools and gives users the ability to perform audits related to performance, accessibility, SEO, and best practices.
How it works:
On the tab titled “Lighthouse,” select the audit categories to be executed from within the interface, and choose “Generate Report.”
Deep Insights:
Why It’s Important:
Performance and accessibility are core to both SEO and user experience. Lighthouse finds problems for the developers and offers step-by-step recommendations on how to fix them.
Keep in mind that debugging JavaScript is more than just console logging. And the Sources Panel offers custom breakpoints for an interactive debugging experience.
Types of Breakpoints:
Pro Tip:
Use conditional breakpoints to save time in complex debugging tasks by only pausing when certain conditions are met.
Knowing how your website will act on slower connections is important on a global level.
Where to Find It:
Open the “Network” panel, click “Throttling,” and select a preset like “Slow 3G” or create a custom profile.
What It Does:
Simulates slower Internet connections to test load times and functionality under constrained conditions.
Practical Applications:
Accessibility means inclusivity and even SEO. In Chrome DevTools, there’s functionality to inspect an accessibility tree. For web accessibility, this is a critical aspect.
How to Get Here:
Right-click on element, select “Inspect”, open Elements panel and then “Accessibility” pane.
Features:
Use Case:
Ensure your web application is accessible, following accessibility guidelines such as WCAG, audit ARIA roles, and contrast ratios.
Memory leaks in JavaScript could make the applications sluggish or even completely crash. The Chrome browser memory profiling tool allows a developer to find such leaks and repair them.
Tools within Memory Panel:
Why It’s Useful:
If your Single Page Application is progressively slowing down due to something not letting go of the memory, memory profiling can find such objects that hold up memory not released by garbage collection.
There’s a bit more to the “Network” than a simple list of requests. Advanced capabilities are available in network performance analysis.
Features:
Use Case:
Troubleshoot why a particular REST API request is failing by analyzing the headers and payload.
The Recorder Panel has recently been added to Chrome DevTools and allows creation and replay of workflows while debugging.
How It Works:
Practical Application:
This will save a lot of time debugging complex multi-step user interactions like checkout flows.
Most of today’s layouts depend on CSS Grid and Flexbox. These would be, at best, a nightmare to debug without the right tools.
Where to Find It:
Inspect an element with grid or flexbox properties and look for the overlay tools in the Elements panel.
Features:
Why It’s a Game-Changer:
Save hours in development by solving layout bugs easily, with no trial and error.
Mastering Chrome DevTools is just as much about knowing the features as it is about using them efficiently.
Chrome Developer Tools are way more than a utility for a browser; they are a developer’s secret weapon. You can debug faster, optimize better, and deliver superior user experiences by leveraging Advanced Developer Tools in Google Chrome.
From memory profiling to accessibility debugging, these Swiss Army knives are there to solve some of the complicated challenges arising in web development. Whether debugging JavaScript, enhancing page load times, or improving web accessibility, Chrome has a host of advanced features that will revolutionize how you build and test web applications.
With the mastering of these tools, you make it not only easier for yourself, but you also contribute to making faster, more accessible, and secure web experiences for users from around the world.
Leave A Reply